The money multiplier is alive
Remember, just a few years ago when a number of economic bloggers tried to assure us, based on some misunderstandings, that banks didn’t lend out reserves and that the ‘money multiplier was dead’?
I wrote several posts explaining why those views were wrong, from debunking endogenous money theory, to highlighting that a low multiplier did not imply that it, and the basis of fractional reserve theory, was ‘dead’.
Even within the economic community that still believed in the money multiplier, there were highly unrealistic (and pessimistic) expectations: high (if not hyper) inflation would strike within a few years we were being told, as the first round of quantitative easing was announced. Of course those views were also wrong: the banking system cannot immediately adjust to a large injection of reserves; even absent interest on excess reserves, it takes decades for new reserves to expand the money supply as lending opportunities are limited at a given point in time.
A few years later, it is time for those claims to face scrutiny. So let’s take a look at what really happened to the US banking system.
This is the M2 multiplier:
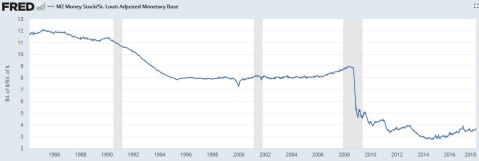
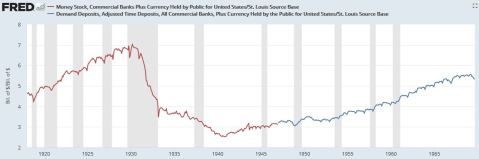
As already pointed out several years ago, the multiplier is low; much lower than it used to be between 1980 and 2009. But it is not unusual and this pattern already happened during the Great Depression. See below:
Similarly to the post-Depression years, the multiplier is now increasing again.
Let’s zoom in:
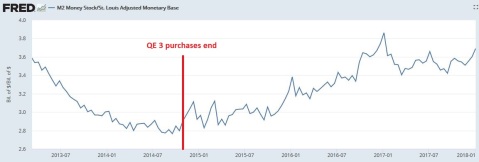
Since the end of QE3, the M2 multiplier in the US has increased from 2.9 to 3.7 in barely more than three years. This actually represents a much faster expansion than that followed the Great Depression: between 1940 and 1950, it increased from 2.5 to 3.5, and from 1950 to 1960, it increased from 3.5 to 4.2.
Unsurprisingly, this increase occurred as excess reserves finally started to decline sustainably:
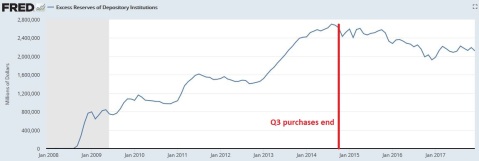
As we all know, following the 1950s, the multiplier eventually went on increasing for a couple more decades, reaching highs during the stagflation of the 1970s and early 1980s. Unless a new major crisis strikes, it is likely that our multiplier will follow the same trajectory, although I am a little worried about the rapid pace at which it is currently increasing. One thing is certain: the money multiplier is alive and well.
5 responses to “The money multiplier is alive”
Leave a reply to Marie Cancel reply
Recent Comments
| pslebow on ‘Sovereign money’:… | |
| pslebow on A critique of Werner’s view on… | |
| Hugo Kramer on Welcome to Spontaneous Fi… | |
| Nathan on A critique of Werner’s view on… | |
| Nathan on More, more, more money endogen… |

Hi Julien, I’m currently working on a project about the endogeneity of money and the Fractional Reserve Banking Theory in Ecuador. I wanted to ask you if you could recommend me some articles to look for
Being a ratio, given the enormous amount of new reserves, it’s clear that now the MM is the inverse image of the excess reserves.
Wouldn’t be more useful just to look at the amount of loans made by banks? What is the utility of the MM besides central bank planning?
I’m learning a lot from your blog (I’ve been reading all your articles for a week), thank you for all this fantastic material.
I’m wondering if you have a theory/understanding of what inflation is or what it is affected by. It seems such an important topic and is seldom mentioned anywhere.
My intuition tells me it has something to do with the value of assets of the Federal Reserve with respect to the amount of currency. When it is said that federal reserve notes are a liability to the Fed, I suppose that since it’s not convertible to gold anymore, it means that I have a claim on their assets and therefore it’s value is linked to the value of the assets held by the Fed.
Am I on the right path or completely lost?
I enjoy the blog and analysis. I would just like to add that I think the spread between IOER and other short term rates can help explain some of this movement. If you add the spread between IOER and Overnight $-LIBOR to the multiplier graph it paints a pretty clear picture. The same is also true if you overlay the same spread with the excess reserve ratio (excess reserves/deposits of all commercial banks). Just my 2 cents.
You definitely did not do the following: “from debunking endogenous money theory”…