150 years of nominal interest rates distortion?
A very useful post was published on the FT Alphaville blog by David Keohane. It shows nominal interest rates levels over the past 5000 years in three different charts.
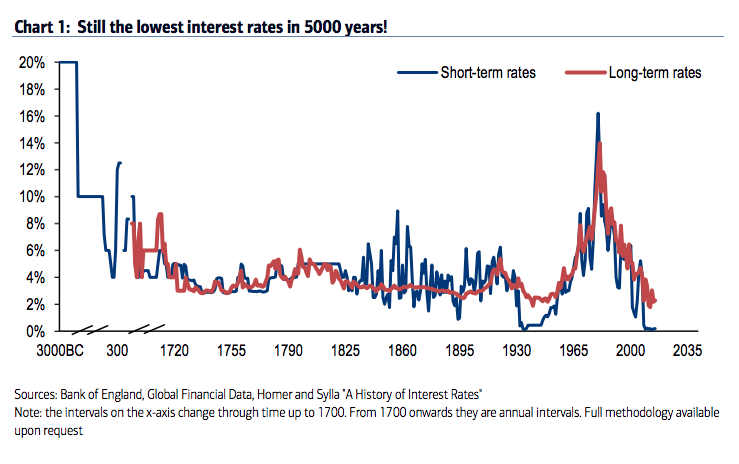
The first one comes from Andy Haldane, from the BoE:

The second one from Hartnett, from Bank of America Merrill Lynch:
The last one comes from Costa Vayenas, from UBS:

Those charts use different sources so don’t look exactly the same. Nevertheless, they all show the same striking facts. In particular, the 20th and 21st centuries seem to have been huge monetary experiments: nominal rates went both sky high and negative within a few decades… Within a period of barely more than a 100 years, rates fell to the bottom (Great Depression), then jumped ridiculously high to counteract inflationary pressure in the 1970s and 1980s (i.e. the disastrous impact of crude Keynesian macro theory) that resulted from the money multiplier recovering after the Depression, then fell to the bottom again or even negative (Great Recession).
Remember: the 20th century was the period of the generalisation of central banking. It definitely looks like they have been successful at stabilising money markets (and remember this paper by Selgin and White, which shows how successful the Fed has been at stabilising the value of the dollar since its creation). In short, great success for central bankers*.
Another interesting fact is that nominal rates started to wildly fluctuate once the BoE was granted the exclusive right to issue banknotes in the London area in 1844. Unlikely to be a coincidence.
Something that worries me though is the current state of monetary policy throughout most of the Western world. Rates are stuck at the zero bound or even went negative for the first time in history. Perhaps this is justified. But I keep wondering whether our economies currently are in a worse state than at any time in history to justify such low rates (although to be fair, Haldane’s chart does show that long-term nominal rates remain around historical levels – but not Hartnett’s).
Real interest rate charts would also have been interesting for a more comprehensive analysis of the underlying drivers of the rate movements we see here. If ever anyone has access to real interest rate data that go back several hundred years, please let me know (probably hard, or even impossible, to obtain as historical inflation data is likely to be non-existent).
In a parallel world, the BoE recently opened a forum weirdly titled ‘Building real markets for the good of the people’ which, putting aside the slightly communist tone of its chosen name, describes markets are “prone to excess” if “left unattended”**. This is another great example of central banks succeeding in making public opinion believe that economic issues originate, not in central bankers’ failed policies, not in economically distortive banking regulation, but in free markets. Which aren’t actually free. Here again Selgin had a remarkable article reporting how the Fed promotes itself.
One reaches some sort of supreme irony after contrasting those BoE statements with the charts above. Worse, central banks’ power, despite the instability they have brought to the economy for 100+ years, is growing, and their adherence to the rule of law has all but vanished (see Salter here and here arguing that a stable monetary framework such as the gold standard or NGDP targeting would respect the rule of law, unlike current regimes, and that adherence to the rule of law should be the primary consideration for judging monetary regimes).
*Sarcasm, of course
**I’m not sure what’s going on at the BoE, but a culture shift seems to be happening: anti-market rhetoric and rather strange monetary and banking theories are overtaking the institution (see my posts on endogenous money theory)
5 responses to “150 years of nominal interest rates distortion?”
Trackbacks / Pingbacks
- - 29 September, 2015
- - 20 October, 2015
- - 28 October, 2015
Leave a comment
Recent Comments
| pslebow on ‘Sovereign money’:… | |
| pslebow on A critique of Werner’s view on… | |
| Hugo Kramer on Welcome to Spontaneous Fi… | |
| Nathan on A critique of Werner’s view on… | |
| Nathan on More, more, more money endogen… |

Real rates would be interesting indeed. I don’t know where to find the interest rate data in these charts but I do know where to find a price index for the UK going back to 1209. You could use that to estimate the inflation premium.
Two observations: it looks like the charts are for annual data. For the US this obscures some important historical volatility that result from banking regulation, at least for short term rates.
Second observation, well, actually more of a question: What were the impact of usury laws on interest rates in some of the older periods of the data?
Thanks Andrew. Looks like a very interesting link even though all dataset from this period will evidently remain unprecise! I’ll take a closer look.
Yes the US experienced unstable rates in the 19th century as banks couldn’t respond to fluctuations in money demand.
As for your question on usury laws, it’s hard to answer, as I don’t know the exact history of all usury laws.
What I know however (coutesy of the historian Jean Andreau), is that usury laws during the Roman period originally fixed interest rates at 100% max. This was reduced to 50% around mid-4th century BC. Interest was then fully abolished in 342BC. We have no clear idea how long this law remained in place, but interest made a comeback later and was then legalised in 88BC, though possibly limited at 12% pa.
Historical records show that interest rates were often in the range of 4 to 12%, very rarely below 4% (which seems to confirm some of the charts above), and texts from the period seem to provide empirical validity to the loanable funds theory by describing how interest rates rose and decline as the supply of credit varied. Finally, what we know is that rates remained broadly stable over time, independently of economic booms and busts. They only varied in war times and other political crises.