The Great Depression and the money multiplier
The money multiplier has collapsed following the introduction of new reserves as central banks engaged in quantitative easing. This has led many economic commentators to declare that the money multiplier did not exist.
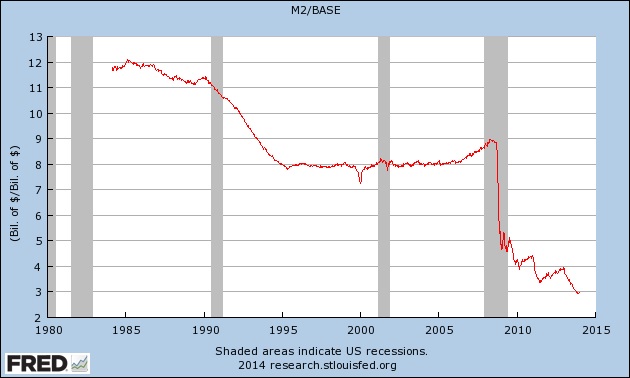
While I have several times said that this wasn’t that straightforward, I stumbled upon a post by Mark Sadowski, on Marcus Nunes’ blog, which includes a very interesting graph of the M2 money multiplier (blue line below) from 1925 to 1970 (I have no idea how he obtained this dataset as I can’t seem to be able to go further back than 1959 on the FRED website).

The multiplier collapsed from 7 in 1930 to a low 2.5 in 1940 and banks that had not disappeared had plenty of excess reserves, which they maintained for a number of reasons (precautionary, lack of demand for lending, low interest rates, Hoover/FDR policies…). This situation looks very similar to what happened during our recent crisis. However, what’s interesting is that the multiplier did eventually increase. In 1970, 30 years after reaching the bottom, the multiplier was back at around 6, meaning a large increase in the money stock. This is what most people miss: it doesn’t just take a few years for new reserves to affect lending; it can take decades.
Unless the Fed takes specific actions to remove (or prevent the use of) current excess reserves, the money multiplier could well get back to its historical level within the next few decades.
Recent Comments
| pslebow on ‘Sovereign money’:… | |
| pslebow on A critique of Werner’s view on… | |
| Hugo Kramer on Welcome to Spontaneous Fi… | |
| Nathan on A critique of Werner’s view on… | |
| Nathan on More, more, more money endogen… |

Trackbacks / Pingbacks