The real reason the Federal Reserve started paying interest on reserves (guest post by Justin Merrill)
I am fascinated by recent policies of interest on reserves, both positive and negative. I understand the argument for the People’s Bank of China paying interest on its deposits since they have a combination of a large balance sheet and high reserve ratios in order to control their exchange rate; their banks would go broke if 20% of their assets earned no income and their domestic inflation would run rampant if they didn’t curb lending. I also understand the logic for negative interest rates to stimulate the economies in Europe. I disagree with these policies, but there’s an internally coherent argument there. What hasn’t made sense to me is the Federal Reserve’s policy of paying interest on both required and excess reserves.
Why would the Fed simultaneously start the counterproductive policies of quantitative easing (QE) and interest on reserves (IOR)? Why would the Fed pursue the deflationary policy of IOR throughout the crisis when labor markets were weak and inflation was usually below their target? What if they could have achieved their policy goals as well or better by sticking to more traditional policies and not been stuck with such a large balance sheet and potential exit problem? My cynical intuition was that it was just a backdoor bailout to banks.
Determined to find the answer, I looked for statements and other sources from the Fed to find out the history of and justifications for IOR. What I finally found confirmed my suspicions and I think shows a big flaw in the Fed’s transparency and policy. What recently renewed my interest was Chair Janet Yellen’s Congressional testimony before the Senate in February, 2015. Senator Pat Toomey asked her about interest on reserves policy. Toomey used to be a bond trader, so he’s more financially savvy than most of his peers. I will summarize their dialogue about IOR but the video is available here and starts a little before one hour-seventeen minutes in: http://www.c-span.org/video/?324477-1/federal-reserve-chair-janet-yellen-testimony-monetary-policy
PT: In the past the Fed conducted monetary policy via Open Market Operations. You have said that you intend to raise the Fed Funds rate by increasing the interest paid on reserves. Since this will transfer money to big money center banks that would have gone to tax payers, why are you doing that instead of simply selling bonds? (emphasis added)
JY: We are paying banks a rate comparable with the market, so there is not a subsidy to banks. Our future contributions may decline when interest rates rise, but our contributions to the Treasury have been enormous in recent times.
Notice what she didn’t answer? The part of his question about why they are even using IOR at all!
According to the Fed’s Oct 6, 2008, press release:
The Financial Services Regulatory Relief Act of 2006 originally authorized the Federal Reserve to begin paying interest on balances held by or on behalf of depository institutions beginning October 1, 2011. The recently enacted Emergency Economic Stabilization Act of 2008 accelerated the effective date to October 1, 2008.
So we know the Fed was interested in using IOR as a tool prior to the crisis but weren’t in a hurry to do so until after the Lehman shock. The expedited authorization came from the TARP bill. So why were they interested in using it at all, and why did it become urgent and necessary in late September, 2008? The press release mentions “Paying interest on required reserve balances should essentially eliminate the opportunity cost of holding required reserves, promoting efficiency in the banking sector” and “Paying interest on excess balances should help to establish a lower bound on the federal funds rate. […] The payment of interest on excess reserves will permit the Federal Reserve to expand its balance sheet as necessary to provide the liquidity necessary to support financial stability while implementing the monetary policy that is appropriate in light of the System’s macroeconomic objectives of maximum employment and price stability.”
So paying interest on required reserves “promotes efficiency?” I think they are channeling Milton Friedman’s observation that reserve requirements are a tax on banks by forcing them to hold non-income earning assets. I’m not a fan of reserve requirements, and maybe it could be argued that they encourage disintermediation or alternative financing schemes that aren’t subject to the regulation, such as shadow banking, and that by paying IORR it offsets that. Fine, what I think is more interesting is the justification for interest on excess reserves. Why were they trying to provide liquidity without creating price inflation or overheating the labor market? Core CPI was below 2% at the time, PCE (an indicator the Fed looks at) was sharply negative, GDP numbers for the first two quarters were really weak and unemployment was trending up and was above 6% since August. There’s a lag to data, but in the October-early December timeframe we are focusing on here, they would have at least had August’s numbers.
Still not satisfied, I looked around at almost a dozen other Fed sources that tried to justify IOR. All of the sources said two or three things in particular: “Milton Friedman told us to pay interest on required reserves in 1959*, Marvin Goodfriend told us IOR could be used as a policy tool in 2002 and in 2008 we were having a hard time hitting our Fed Funds target.” I know hindsight is 20/20, but given the economic environment explained above, if you are providing liquidity and the economy is still stalling and you are missing your Fed Funds target on the low side, the problem is your target! You must REALLY trust your models to be so confident that a Fed Funds rate of two percent is worth defending in a liquidity crisis. I was about to chalk up the policy to mere incompetence and panicking in the fog of war when I came across this wonderful essay published by the Richmond Fed. It actually gives a fully honest account of what happened and why it was deemed urgent to start IOR:
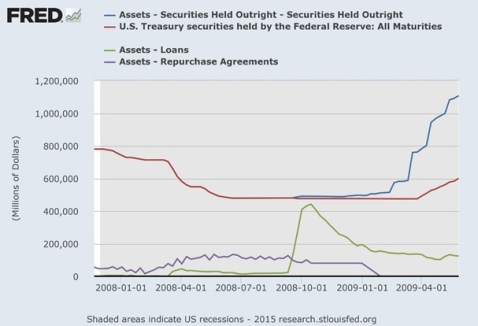
This feature became important once the Fed began injecting liquidity into financial markets starting in December 2007 to ease credit conditions. In making these injections, the Fed created money to extend loans to financial institutions. Those institutions provided as collateral securities from their portfolio that had, as a result of the financial market turmoil, become difficult to trade and value. This action essentially replaced illiquid assets in their portfolio with a credit to their account at the Fed, which would add reserves to the banking system. Adding reserves to the system will, under usual circumstances, exert downward pressure on the fed funds rate. At the time the Fed was not yet facing the zero-lower-bound on interest rates that it faces today. Thus, the injections had the potential to push the fed funds rate below its target, increasing the overall supply of credit to the economy beyond a level consistent with the Fed’s macroeconomic policy goals, particularly concerning price stability. To avoid this outcome, the Fed “sterilized” the effect of liquidity injections on the overall economy: It sold an equal amount in Treasury securities from its own account to banks. Sterilization offset the injections’ effect on the monetary base and therefore the overall supply of credit, keeping the total supply of reserves largely unchanged and the fed funds rate at its target. Sterilization reduced the amount in Treasury securities that the Fed held on its balance sheet by roughly 40 percent in a year’s time, from over $790 billion in July 2007 to just under $480 billion by June 2008. However, following the failure of Lehman Brothers and the rescue of American International Group in September 2008, credit market dislocations intensified and lending through the Fed’s new lending facilities ballooned. The Fed no longer held enough Treasury securities to sterilize the lending.
This led the Fed to request authority to accelerate implementation of the IOR policy that had been approved in 2006. Once banks began earning interest on the excess reserves they held, they would be more willing to hold on to excess reserves instead of attempting to purge them from their balance sheets via loans made in the fed funds market, which would drive the fed funds rate below the Fed’s target for that rate. When the Fed stopped sterilizing its liquidity injections, the monetary base (which is comprised of total reserves in the banking system plus currency in circulation) ballooned in line with Fed lending, from about $847 billion in August 2008 to almost $2 trillion by October 2009. However, this did not result in a proportional increase in the overall money supply. This result is likely due largely to an undesirable lending environment: Banks likely found it more desirable to hold excess reserves in their accounts at the Fed, earning the IOR rate with zero risk, given that there were few attractive lending opportunities. That the liquidity injections did not result in a proportional increase in the money supply may also be due to banks’ increased demand to hold liquid reserves (as opposed to individually lending those excess reserves out) in the wake of the financial crisis.
So the truth is that when the subprime mortgage crisis blew-up in December, 2007 the Fed started SELLING hundreds of billions in treasuries to sterilize their credit facility that engaged in repo of MBS. Since this did not provide aggregate liquidity, this was not a lender of last resort function, this was a credit policy to support MBS. Then after Bear Stearns failed in March, 2008 the Fed sold more treasuries to make billions in direct loans to firms such as Bear (to aid in their purchase by JP Morgan) and AIG. At their peak, during the Lehman shock, their direct lending totaled well over $400 billion, or about half their balance sheet.
 http://research.stlouisfed.org/fred2/graph/?g=16fS
The damning truth is the Fed felt the urgent need to institute IOR because they were running low on treasuries but wanted to provide more liquidity. They were afraid to initially expand their balance sheet because in October, 2008 they were still concerned about inflation! Talk about missing the mark. They were concerned because the Fed Funds rate was below their target and they couldn’t control it. What they don’t seem to realize is that the Fed Funds is a barometer of liquidity. You don’t make the weather warmer by tricking your thermometer into not going below 70 degrees. I suspect it is the “Neo-Wicksellians” like Michael Woodford who took the money out of Wicksell who are to blame for this. This is a perfect example of Goodhart’s Law: “when a measure becomes a target, it ceases to be a good measure.” You can see in the chart below they tried, and failed, to create an interest rate channel by initially pegging the interest on excess reserves lower than the target rate. Eventually they gave up and harmonized all the rates at 25 bps. The effective Fed Funds remained below that because some institutions, such as the GSEs, have access to the Fed Funds market but not deposits at the Fed. This means there’s an arbitrage opportunity for banks to borrow on the Fed Funds market and deposit at the Fed. Since GSEs were nationalized, this might be considered another public subsidy. Either way, the primary dealer model and other differential treatment of institutions is broken.
 http://research.stlouisfed.org/fred2/graph/?g=16fY
We no longer have the initial conditions that justified interest on reserves. We are not above the ZLB and fearing inflation while wanting to increase the balance sheet. We are in the exact opposite. The Fed should normalize, including abandoning IOR. This is Bernanke’s legacy. The same man who promised, “We won’t do it again” got so caught up in the act of directing credit, experimenting with new tools and obeying his models that he forgot to listen to Bagehot’s advice or even professor Bernanke’s.
*Friedman, Milton. 1959. A Program for Monetary Stability.
Negative interest rates and free banking
Is the universe about to make a switch to antimatter? Interest rates in negative territory is the new normal. Among regions that introduced negative rates, most have only put them in place on deposit at the central bank (like the -0.2% at the ECB for instance). Sweden’s Riksbank is innovating with both deposit and repo rates in negative territory. It now both has to pay banks that borrow from it overnight and… charge commercial banks that deposit money with it, like a mirror image of the world we used to know. However, like antimatter and matter and the so-called CP violation (which describes why antimatter has pretty much disappeared from the universe), positive rates used to dominate the world. Until today.

Many of those monetary policy decisions seem to be taken in a vacuum: nobody seems to care that the banking regulation boom is not fully conductive to making the banking channel of monetary policy work (and bankers are attempting to point it out, but to no avail). In some countries, those decisions also seem to be based on the now heavily-criticised inflation target, as CPI inflation is low and central bankers try to avoid (whatever sort of) deflation like the plague.
As I described last year with German banks, negative rates have….negative effects on banks: it further amplifies the margin compression that banks already experience when interest rates are low by adding to their cost base, and destabilise banks’ funding structure by providing depositors a reason to withdraw, or transfer, their deposits. Some banks are now trying to charge some of their largest, or wealthiest, customers to offset that cost. At the end of the day, negative rates seem to slightly tighten monetary policy, as the central bank effectively removes cash from the system.
It is why I was delighted to read the below paragraphs in the Economist last week, a point that I have made numerous times (and also a point that many economists seem not to understand):
In fact, the downward march of nominal rates may actually impede lending. Some financial institutions must pay a fixed rate of interest on their liabilities even as the return on their assets shrivels. The Bank of England has expressed concerns about the effect of low interest rates on building societies, a type of mutually owned bank that is especially dependent on deposits. That makes it hard to reduce deposit rates below zero. But they have assets, like mortgages, with interest payments contractually linked to the central bank’s policy rate. Money-market funds, which invest in short-term debt, face similar problems, since they operate under rules that make it difficult to pay negative returns to investors. Weakened financial institutions, in turn, are not good at stoking economic growth.
Other worries are more practical. Some Danish financial firms have discovered that their computer systems literally cannot cope with negative rates, and have had to be reprogrammed. The tax code also assumes that rates are always positive.
In theory, most banks could weather negative rates by passing the costs on to their customers in some way. But in a competitive market, increasing fees is tricky. Danske Bank, Denmark’s biggest, is only charging negative rates to a small fraction of its biggest business clients. For the most part Danish banks seem to have decided to absorb the cost.
Small wonder, then, that negative rates do not seem to have achieved much. The outstanding stock of loans to non-financial companies in the euro zone fell by 0.5% in the six months after the ECB imposed negative rates. In Denmark, too, both the stock of loans and the average interest rate is little changed, according to data from Nordea, a bank. The only consolation is that the charges central banks levy on reserves are still relatively modest: by one estimate, Denmark’s negative rates, which were first imposed in 2012, have cost banks just 0.005% of their assets.
Additionally, a number of sovereign, and even corporate, bonds yields have fallen (sometimes just briefly) into negative territory, alarming many financial commentators and investors. The causes are unclear, but my guess is that what we are seeing is the combination of unconventional monetary policies (QE and negative rates) and artificially boosted demand due to banking regulation (and there is now some evidence for this view as Bloomberg reports that US banks now hoard $2Tr of low-risk bonds). Some others report that supply is also likely to shrink over the next few years, amplifying the movement. There are a few reasons why investors could still invest in such negative-yielding bonds however.
As Gavyn Davies points out, we are now more in unknown than in negative territory. Nobody really knows how low rates can drop and what happens as monetary policy (and, I should add, regulation) pushes the boundaries of economic theory. At what point, and when, will economic actors start reacting by inventing innovative low-cost ways to store cash? The convenience yield of holding cash in a bank account seems to be lower than previously estimated, although it is for now hard to precisely estimate it as only a tiny share of the population and corporations is subject to negative rates (banks absorb the rest of the cost). The real test for negative rates will occur once everyone is affected.
Free markets though can’t be held responsible for what we are witnessing today. As George Selgin rightly wrote in his post ‘We are all free banking theories now’, what we currently experience and the options we could possibly pick have to measure up against what would happen in a free banking framework.
Coincidentally, a while ago, JP Koning wrote a post attempting to describe how a free banking system could adapt to a negative interest rates environment. He argued that commercial banks faced with negative lending rates would have a few options to deal with the zero lower bound on deposit rates. He came up with three potential strategies (I’ll let you read his post for further details): remove cash from circulation by implementing ‘call’ features, cease conversion into base money, and penalize cash by imposing through various possible means what is effectively a negative interest rate on cash. I believe that, while his strategies sound possible in theory, it remains to be seen how easy they are to implement in practice, for the very reason that the Economist explains above: competitive forces.
But, more fundamentally, I think his assumptions are the main issue here. First, the historical track record seems to demonstrate that free banking systems are more stable and dampen economic and financial fluctuations. Consequently, a massive economic downturn would be unlikely to occur, possibly unless caused by a massive negative supply shock. Even then, the results in such economic system could be short-term inflation, maintaining nominal (if not real) interest rates in positive territory.
Second (and let’s leave my previous point aside), why would free banks lend at negative rates in the first place? This doesn’t seem to have ever happened in history (and surely pre-industrial rates of economic growth were not higher than they are now, i.e. ‘secular stagnation’) and runs counter to a number of theories of the rate of interest (time preference, liquidity preference, marginal productivity of capital, and their combinations). JPK’s (and many others’) reasoning that depositors wouldn’t accept to hold negative-yielding deposits for very long similarly applies to commercial banks’ lending.
Why would a bank drop its lending rate below zero? In the unrealistic case of a bank that does not have a legacy loan book, bankers would be faced by two options: lend the money at negative rates, during an economic crisis with all its associated heightened credit and liquidity risk, or keep all this zero-yielding cash on its balance sheet and make a loss equivalent to its operating costs. If a free bank is uncertain to be able to lower deposit rates below lending rates, better hold cash, make a loss for a little while, the time the economic crisis passes, and then increase rates again. This also makes sense in terms of competitive landscape. A bank that, unlike its competitors, decides to take a short-term loss without penalising the holders of its liabilities is likely to gain market shares in the bank notes (and deposits) market.
Now, in reality, banks do have a legacy loan book (i.e. ‘back book’) before the crisis strike, a share of which being denominated at fixed, positive, nominal interest rates. Unless all customers default, those loans will naturally shield the bank from having to take measures to lower lending rates. The bank could merely sit on its back book, generating positive interest income, and not reinvest the cash it gets from loan repayments. Profits would be low, if not negative, but it’s not the end of the world and would allow banks to support their brand and market share for the longer run*.
Finally, the very idea that lending rates (on new lending, i.e. ‘front book’) could be negative doesn’t seem to make sense. Even if we accept that the risk-free natural rate of interest could turn negative, once all customer-relevant premia are added (credit and liquidity**), the effective risk-adjusted lending rate is likely to be above the zero bound anyway. As the economic crisis strikes, commercial banks will naturally tend to increase those premia for all customers, even the least risky ones. Consequently, a bank that lent to a low-risk customer at 2% before the crisis, could well still lend to this same customer at 2% during the crisis (if not higher), despite the (supposed) fall of the risk-free natural rate.
I conclude that it is unlikely that a free banking system would ever have to push lending (or even deposit) rates in negative territories, and that this voodoo economics remains a creature of our central banking system.
*Refinancing remains an option for borrowers though. However, in crisis times, it’s likely that only the most creditworthy borrowers would be likely to refinance at reasonable rates (which, as described above, could indeed remain above zero)
**Remember this interest rate equation that I introduced in a very recent post:
Market rate = RFR + Inflation Premium + Credit Risk Premium + Liquidity Premium
Photo: MIT
Pushing market rationality too far
In a new post on Switzerland, Scott Sumner said (my emphasis):
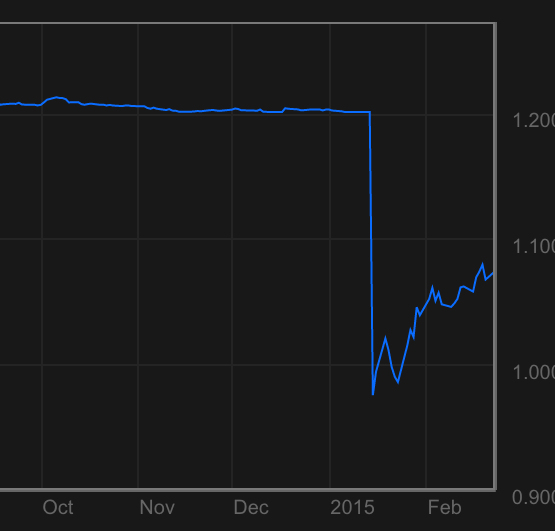
The following graph shows that the SF has fallen from rough parity with the euro after the de-pegging, to about 1.08 SF to the euro today:
And this graph shows that the Swiss stock market, which crashed on the decision that some claimed was “inevitable” (hint, markets NEVER crash on news that is inevitable), has regained most of its losses.

I often enjoy what Scott Sumner writes, but this comment is from someone who doesn’t understand, or has no experience in, financial markets. We all know that Sumner strongly believes in rational expectations and the EMH. But this is pushing market efficiency and rationality too far.
According to Sumner, “markets never crash on news that is inevitable”. Really? Is he saying that markets believed the Euro peg would remain in place forever (which is the only necessary condition for the de-pegging not being ‘inevitable’)?
In reality many investors, if not most (though it can’t be said with certainty), were aware that the peg would be removed and of the resulting potential consequences for Swiss companies. So why the crash?
While investors surely knew that the peg wouldn’t last, they didn’t know when it would end. They were acting on incomplete information. However, this is perhaps what Sumner implies: the Swiss central bank should have provided markets with a more precise statement of when, and in what conditions, the peg would end. Markets would have revised their expectations and priced in the information. This reasoning underpins the rationale for monetary policy rules and forward guidance. But in practice, providing ‘guidance’ isn’t easy: central bankers are not omniscient, have imperfect access to information and cannot accurately forecast the future in an ever-changing world. See what happened to the BoE’s forward guidance policy, which ended up not being much guidance at all as central bankers changed their minds as the economic situation in the UK evolved*.
But the rational expectations argument itself can be used to describe many different situations. If investors believe the peg will end at some point, but don’t know exactly when, it is arguably as ‘rational’ for them to try to maximise gains as long as they could and to try to exit the market just before it crashes, as it is ‘rational’ to adapt their positions to minimise their risk exposure. When the market finally does crash, it often overshoots, for the same reason: benefiting from a short-term situation to maximise profits.
Taking advantage of monetary policy is what traders do. It is their job. Of course, many will fail in their attempt. But necessarily identifying rational expectations with strong short-term risk-aversion and immediate inclusion of external information into prices is abusive.
This latest Bloomberg article shows that close to 20% of traders expect the Fed to raise rates in June, and consequently have surely put in place trading strategies around this belief, and are likely to react negatively if their expectations aren’t fulfilled. However, who doubts that a rate rise is ‘inevitable’? This demonstrates the price-distorting ability of central banks. In order to limit extreme price fluctuations and crashes, the better central banks can do is to disappear from the marketplace entirely.
*Other practical restrictions on guidance include the fact that, while professional investors are likely to be aware of their significance, the rest of the population has no idea what the hell you’re talking about, if it has even heard of it. As a result, the efforts the BoE made to reassure UK borrowers that rates would not rise in the short-run seemed pointless, as virtually no average Joe got it, implying that most people didn’t change their borrowing behaviour/plan in consequence.
I have made a case for rule-based policies a while ago, which I do believe would limit distortions to an extent.
Central banks don’t/do/don’t/do control interest rates
Ben Southwood and I agree on most things but a few topics. Whether central banks’ decisions affect interest rates is one of those, though I do think we have more common than we’re willing to admit. Here are the various reasons that convince me that central banks exert a relatively strong influence on most market rates.
On ASI’s blog, Ben wrote a piece about a 2013 research paper from Fama, who looked into interest rate time series to determine whether or not the Fed controlled interest rates. According to Ben’s own interpretation of the paper, the answer is ‘probably not’. Ironically, my take is completely different.
Throughout most of his paper, Fama’s results do indicate that the Fed exercises a relatively firm grip on all sorts of interest rates, as he admits it himself many times. For example, in his conclusion he writes:
A good way to test for Fed effects on open market interest rates is to examine the responses of rates to unexpected changes in the Fed’s target rate. Table 5 confirms that short-term rates (the one month commercial paper rate and three-month and six-month Treasury bill rates), respond to the unexpected part of changes in TF. Table 5 is the best evidence of Fed influence on rates, and event studies of this sort are center stage in the active Fed literature.
But I find Fama a little biased as he always tries to defend his original position that the Fed does not exert such a strong control:
But skeptics have a rejoinder. The response of short rates to unexpected changes in the Fed’s target rate might be a signaling effect. Rates adjust to unexpected changes in TF because the Fed is viewed as an informed agent that sets TF to line up with its forecasts of how market forces will shape open market rates.
Or also:
The Table 4 evidence that short-term interest rates forecast changes in the Fed funds target rate is not news (Hamilton and Jorda 2002). For those who believe in a powerful Fed, the driving force is TF, the concrete expression of Fed interest rate policy, and the forecast power of short rates simply says that rates adjust in advance to predictable changes in the Fed’s target rate. (See, for example, Taylor 2001.) The evidence is, however, also quite consistent with a passive Fed that changes TF in response to open market interest rates. There are, of course, scenarios in which both forces are at work, possibly to different extents at different times. The Fed may go passive and let the market dictate changes in TF when inflation and real activity are satisfactory, but turn active when it is dissatisfied with the path of inflation or real activity. This mixed story is also consistent with the evidence in Table 3 that the Fed funds rate moves toward both the open market commercial paper rate and the Fed’s target rate.
However Fama never explains why the Fed would simply passively change its base rate in response to private markets. This seems to defeat the purpose of having an active monetary policy.
In short, most of the evidences that Fama finds seem to demonstrate that the Fed indeed does control most interest rates to an extent (in particular short-term ones). But he does not seem to accept his own result and tries to come up with alternative explanations that are less than convincing, to say the least. He concludes by basically saying that…we cannot come to a conclusion.
But Fama’s paper suffers from a major flaw. Let’s break down a market interest rate here:
Market rate = RFR + Inflation Premium + Credit Risk Premium + Liquidity Premium
Fama’s dataset wrongly runs regressions between Fed’s base rate movements and observable market yields on some securities. The rate that the Fed influences is the risk free rate (RFR). But as seen above, market rates contain a number of premia that vary with economic conditions and the type of security/lending and on which the Fed has limited control.
For instance, when a crisis strikes, the credit risk premium is likely to jump. In response, the Fed is likely to cut its base rate, meaning the RFR declines. But the observable rate does not necessarily follow the Fed movement. It all depends on the amplitude of the variation in each variable of the equation above. Hence the correlation will only provide adequate results if the economic conditions are stable, with no expected change in inflation or credit risk. Does this imply that the Fed has no control over the interest rate? Surely not, as the RFR it defines is factored in all other rates. In the example above, the market rates ends up lower than it would have normally been if fully set by private markets.
David Beckworth had a couple of interesting charts on its blog, which attempted to strip out premia from the 10-year Treasury yield (it’s not fully accurate but better than nothing):

Now compare the 1990-2014 non-adjusted and adjusted 10-year Treasury yield with the evolution of the Fed base rate below:

The shapes of the adjusted 10-year yield and the Fed funds rate curves are remarkably similar, whereas this isn’t the case for the unadjusted yield*. Yet most of Fama’s argument about the Fed having a limited influence on long-term rates rests on his interpretation of the evolution of the spread between the Fed funds target rate and the unadjusted 10-year yield.
(the same reasoning applies to commercial paper spread, though the inflation premium is close to nil in such case)
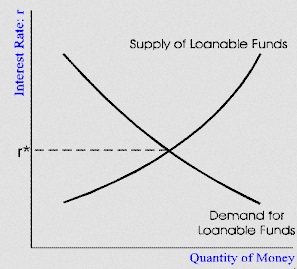
Second, I find it hard to understand Ben’s point that markets set rates, when central banks’ role is indeed to define monetary policies and, by definition, impact those market rates. If only markets set rates, then surely it is completely pointless to have central banks that attempt to control monetary policies through various tools, including the control on the quantity of high-powered money. In a simple loanable funds model (let’s leave aside the banking transmission mechanism), in which the interest rate is defined by the equilibrium point between supply and demand for loanable funds, it is quite obvious that a central bank injecting, or removing, base money from the system (that is, pushing the supply curve one way or another) will affect the equilibrium rate. Of course the central bank does not control the demand curve. But the fact that the bank does not have a total control over the interest rate does not imply that it has none and that its policies have no effect. What does count is that the resulting equilibrium rate differs from the outcome that free markets would have produced.
I am also trying to get my head around what I perceive as a contradiction here (I might be wrong). Market monetarists (of whom Ben seems to belong) believe that money has been ‘tight’ throughout the recession due to central banks’ misguided monetary policies. They seem to think that rates would have dropped much faster in a free market. This seems to demonstrate that market monetarist believe in the strong influence of central banks on many rates. But according to Ben, central banks do not have much influence on rates. Does he imply that free markets were responsible for the ‘tight’ policy that followed the crisis?
So far in this post we’ve only seen cases in which the central bank indirectly affects market rates. But some markets are linked to the central bank base rate from inception. For instance, in the UK, most mortgage rates (‘standard variable rates’) are explicitly and contractually defined as ‘BoE Base Rate + Margin’**. The margin rarely changes after the contract has been agreed. Any change in the BoE rate ends up being automatically reflected in the rate borrowers have to pay (that is, before banks are all forced to widen the contract margin because of the margin compression phenomenon, as I described in my previous exchange with Ben here and here). The only effect of banking competition is to lead to fluctuations of a few bp up or down on newly originated mortgages (i.e. one bank offers you BoE + 1.5% and another one BoE + 1.3%).
At the end of the day, I have the impression that a part of our disagreement is merely due to semantics. I don’t think anybody has declared that central banks fully control rates. This would be foolish. But they certainly exert a strong influence (at least) through the risk-free rate, and this reflects on all other rates across maturities and risk profiles.
*To be fair, it does look like some of the Fed’s decisions were anticipated by markets and reflected in Treasury yields just before the target rate was changed.
**In some other countries the link is looser, as the central bank rate is replaced by the local interbank lending rate (Libor, Euribor…).
Cachanosky on the productivity norm, Hayek’s rule and NGDP targeting
Nicolas Cachanosky and I should get married (intellectually, don’t get overexcited). Some time ago, I wrote about his very interesting paper attempting to start the integration of finance and Austrian capital theories. A couple of weeks ago, I discovered another of his papers, published a year ago, but which I had completely missed (coincidentally, Ben Southwood also discovered that paper at the exact same time).
Titled Hayek’s Rule, NGDP Targeting, and the Productivity Norm: Theory and Application, this paper is an excellent summary of the policies named above and the theories underpinning them. It includes both theoretical and practical challenges to some of those theories. Cachanosky’s paper reflects pretty much exactly my views and deserved to be quoted at length.
Cachanosky defines the productivity norm as “the idea that the price level should be allowed to adjust inversely to changes in productivity. […] In other words, money supply should react to changes in money demand, not to changes in production efficiency.” Referring to the equation of exchange, he adds that “because a change in productivity is not in itself a sign of monetary disequilibrium, an increase in money supply to offset a fall in P moves the money market outside equilibrium and puts into motion an unnecessary and costly process of readjustment”, which is what current central bank policies of price level targeting do. The productivity norm allows mild secular deflation by not reacting to positive ‘real’ shocks.
He goes on to illustrate in what ways Hayek’s rule and NGDP targeting resemble and differ from the productivity norm:
There are instances where the productivity norm illuminated economists that talked about monetary policy. Two important instances are Hayek during his debate with Keynes on the Great Depression and the market monetarists in the context of the Great Recession. Both, Hayek and market monetarism are concerned with a policy that would keep monetary equilibrium and therefore macroeconomic stability. Hayek’s Rule and NGDP Targeting are the denominations that describe Hayek’s and market monetarism position respectively. Taking the presence of a central bank as a given, Hayek argues that a neutral monetary policy is one that keeps constant nominal income (MV) stable. Sumner argues instead that
“NGDP level targeting (along 5 percent trend growth rate) in the United States prior to 2008 would similarly have helped reduce the severity of the Great Recession.”
Hayek’s Rule of constant nominal income can be understood in total values or as per factor of production. In the former, Hayek’s Rule is a notable case of the productivity norm in which the quantity of factors of production is assumed to be constant. In the latter case, Hayek’s rule becomes the productivity norm. However, for NGDP Targeting to be interpreted as an application that does not deviate from the productivity norm, it should be understood as a target of total NGDP, with an assumption of a 5% increase in the factors of production. In terms of per factor of production, however, NGDP Targeting implies a deviation of 5% from equilibrium in the money market.
Cachanosky then highlights his main criticisms of NGDP targeting as a form of nominal income control, that is the distinction between NGDP as an ‘emergent order’ and NGDP as a ‘designed outcome’. He says that targeting NGDP itself rather than considering NGDP as an outcome of the market can affect the allocation of resources within the NGDP: “the injection point of an increase in money supply defines, at least in the short-run, the effects on relative prices and, as such, the inefficient reallocation of factors of production.” In short, he is referring to the so-called Cantillon effect, in which Scott Sumner does not believe. I am still wondering whether or not this effect could be sterilized (in a closed economy) simply by growing the money supply through injections of equal sums of money directly into everyone’s bank accounts.
To Cachanosky (and Salter), “NGDP level matters, but its composition matters as well.” He believes that targeting an NGDP growth level by itself confuses causes and effects: “that a sound and healthy economy yields a stable NGDP does not mean that to produce a stable NGDP necessary yields a sound and healthy economy.” He points out that the housing bubble is a signal of capital misallocation despite the fact that NGDP growth was pretty stable in pre-crisis years.
I evidently fully agree with him, and my own RWA-based ABCT also points to lending misallocation that would also occur and trigger a crisis despite aggregate lending growth remaining stable or ‘on track’ (whatever that means). I should also add that it is unclear what level of NGDP growth the central bank should target. See the following chart. I can identify many different NGDP growth ‘trends’ since the 1940s, including at least two during the ‘great moderation’. Fluctuations in the trend rate of US NGDP growth can reach several percentage points. What happens if the ‘natural’ NGDP growth changes in the matter of months whereas the central bank continues to target the previous ‘natural’ growth rate? Market monetarists could argue that the differential would remain small, leading to only minor distortions. Possibly, but I am not fully convinced. I also have other objections to NGDP level targeting (related to banking and transmission mechanism), but this post isn’t the right one to elaborate on this (don’t forget that I view NGDP targeting as a better monetary policy than inflation targeting but a ‘less ideal’ alternative to free banking or the productivity norm).
 Cachanosky also points out that NGDP targeting policies using total output (Py in the equation of exchange) and total transactions (PT) do not lead to the same result. According to him “the housing bubble before 2008 crisis is an exemplary symptom os this problem, where PT increases faster than Py.”
Finally, he reminds us that a 100%-reserve banking system would suffer from an inelastic money supply that could not adequately accommodate changes in the demand for money, leading to monetary equilibrium issues.
I can’t reproduce the whole paper here, but it is full of very interesting (though quite technical) details and I strongly encourage you to take a look.
Easy money is secondary to bank regulation in triggering housing booms
I’ve already reported on the excellent piece of research that Jordà et al published last year. Last month, they elaborated on their previous research to publish another good paper, titled Betting the House. While their previous paper focused on gathering and aggregating real estate and business lending data across most major economies since the second half of the 19th century, their new paper built on this great database to try to extract correlations between ‘easy’ monetary conditions and housing bubbles.
Remember their remarkable chart, to which I had added Basel and trend lines:
 They also produced the following chart, which shows disaggregated data across countries (click on it to zoom in). I added red vertical bars that show the introduction of Basel 1 regulations (roughly… it’s not very precise). What’s striking is that, almost everywhere, mortgage debt boomed as a share of GDP and overtook business lending. It was a simultaneous paradigm change that can hardly be separated from the major changes in banking regulation and supervision that occurred at that time.
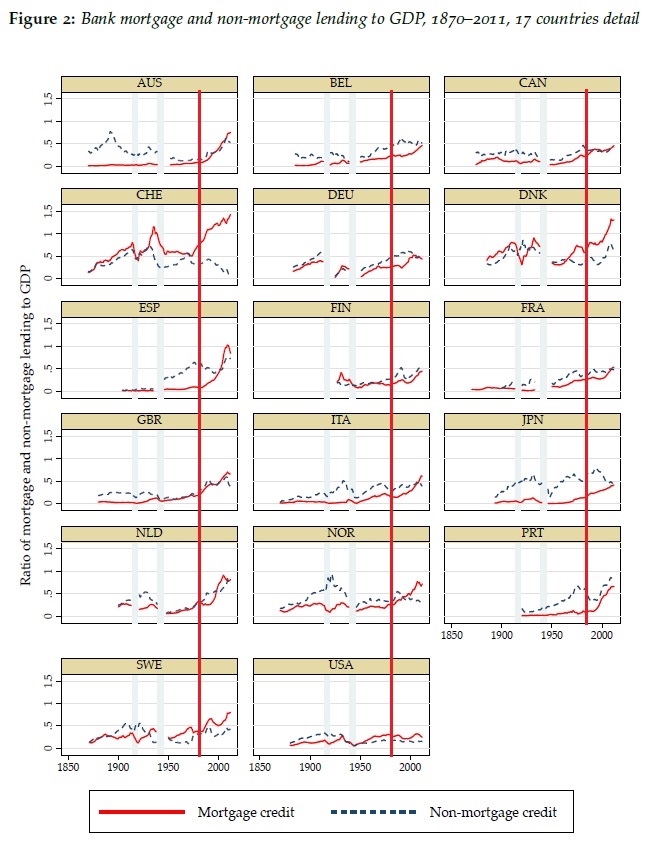 Their new study repeats most of what had been said in their previous one (i.e. that mortgage credit had been the primary driver of post-WW2 bank lending) and then compares real estate lending cycles with monetary policy. And they conclude that:
loose monetary conditions lead to booms in real estate lending and house prices bubbles; these, in turn, materially heighten the risk of financial crises. Both effects have become stronger in the postwar era.
As I said in my post on Jordà et al’s previous research, most (if not all) of what they identify as post-WW2 housing cycles actually happened post-Basel implementation. I wish they had differentiated pre- and post-Basel cycles.
They start by assessing the stance of monetary policy in the Eurozone over the past 15 years, using the Taylor rule as an indicator of easy/tight monetary policy. While the Taylor rule is possibly not fully adequate to measure the natural rate of interest, it remains better than the simplistic reasoning that low rates equal ‘easy’ money and high rates equal ‘tight’ money. According to their Taylor rule calculation, the stance of monetary policy in the Eurozone before the crisis was too tight in Germany and too loose in Ireland and Spain. In turn they say, this correlated well with booms in mortgage lending and house prices (see chart below).
 At first sight, this seems to confirm the insight provided by the Austrian business cycle theory: Spain and Ireland benefited from interest rates that were lower than their domestic natural rates, launching a boom/bust cycle driven by the housing market. (While Germany was the ‘sick’ man of Europe as the ECB policy was too tight in its case)
And while this is probably right, this is far from being the whole story. In fact, I would say that ‘easy’ monetary policy is only secondary to banking regulation in causing financial crises through real estate booms. As I have attempted to describe a little more technically here, Basel reorganised the allocation of loanable funds towards real estate, at the expense of business lending. This effectively lowered the market rate of interest on real estate lending below its natural rate, triggering the unsustainable housing cycle, and preventing a number of corporations to access funds to grow their business. By itself, Basel causes the discoordination in the market for loanable funds: usage of the newly extended credit does not reflect the real intertemporal preference of the population. No need for any central bank action.
What ‘easy’ monetary policy does is to amplify the downward movement of interest rates, boosting real estate lending further. But it is not the initial cause. In a world without Basel rules, the real estate boom would certainly have occurred in those proportions, and quick lending growth would have been witnessed across sectors and asset classes. The disproportion between real estate and business lending in the pre-crisis years suggests otherwise.
* They continue by building a model that tries to identify the stance of monetary policy throughout the more complex pre-WW2 and pre-1971 monetary arrangements. I cannot guarantee the accuracy of their model (I haven’t spent that much time on their paper) but as described above, everything changed from the 1980s onward anyway.
PS: The ‘RWA-based ABCT’ that I described above is one of the reasons why I recently wrote a post arguing that the original ABCT needed new research to be adapted to our modern financial system and be of interest to policymakers and the wider public.
Why can’t economists understand margin compression?
Are basic accounting statements so difficult to interpret? According to Viennacapitalist, who commented on my previous post, it does seem so. At least for macroeconomists. Indeed, Werner seemed to imply that most economists did not know that deposits sat on the liability side of a bank’s balance sheet (he’s surely wrong), and I have many times pointed out the central bankers’ and policymakers’ misunderstanding of banking mechanics.
Three researchers from the BIS just confirmed the trend. In a new working paper called ‘Has the transmission of policy rates to lending rates been impaired by the Global Financial Crisis?’, they wonder, and try to find out, why spreads between central banks’ base rates and lending rates have jumped once base rates reached the zero-lower bound.
It’s a debate I’ve already had almost a year ago, when I tried to explain that, due to the margin compression effect (an accounting phenomenon), spreads would have to increase in order allow banks to generate sufficient earnings to report (at least) positive accounting net incomes (see here and here).
Those BIS researchers have come up with the same sort of dataset and charts I did over the past year, although they also looked at the US (but didn’t look as other European countries, unlike what I did in this post). This is what they got:
 This looks very very similar to my own charts. Clearly, spreads jumped across the board: pre-crisis, they were around 1.5% in the US, 1.5% in the UK and 1.25/1.5% in Spain and Italy. In 2009/2010, with base rate dropping to the zero-lower bound, things changed completely: spreads were of 3% in the US, 2.25% in the UK, 2% in Spain and 1.5% in Italy. Rates had not dropped as much as base rates. Worse, spreads on average increased afterwards: by 2013, spreads were around 2.5% in all countries.
The BIS researchers tried to understand why. Unfortunately, they focused on the wrong factors. They built a model that concluded that the “less pass-through seems to be related in part to higher premium for risk required by banks and by worsening of their financial conditions as well.” They are probably right that some of these factors did play a role. But they cannot explain why the spread remains so elevated even in economies that have experienced strong recoveries such as the US or, more recently the UK.
But their study also has a number of other problems. First, they used new lending data only. It is extremely tricky to extract credit risk information from new lending rate figures. Why? Because new lending rates only show credit actually extended. Many borrowers cannot access credit altogether or simply refuse to do so at high rates. Consequently, the figures could well only reflect borrowers that have relatively good credit risk in the first place as banks try to eliminate credit risk from their portfolio. Second, they never ever discuss operating costs and margin compression, as if banks could simply lower interest income to close to 0 and get away with it.
But for this, they should have looked at two things: deposit rates and banks’ back books (i.e. legacy lending). Not new lending only. When the margin between deposit rates and lending rates on back books fall below banks’ operating costs, banks have to offset that decline by increasing spreads. This is why I suggested that the actual lowering base rates ceased to be effective from around 1.5 to 2% downward as a means of reducing household and companies’ borrowing rates.
Problem is, very few researchers and policymakers seem to get it. Patrick Honohan, of the Irish Central Bank, and Benoit Coeuré, of the ECB, do seem to understand what the issue is. Bankers and consultants have for a while (see Deloitte at the end of this post). Some economic commentators assert that it is hard to figure out why bankers keep complaining about low rates. This dichotomy between theorists and practitioners is leading to misguided, and potentially harmful, policies.
But let me ask a simple question. How hard is it to understand bank accounting really?
The Great Depression and the money multiplier
The money multiplier has collapsed following the introduction of new reserves as central banks engaged in quantitative easing. This has led many economic commentators to declare that the money multiplier did not exist.

While I have several times said that this wasn’t that straightforward, I stumbled upon a post by Mark Sadowski, on Marcus Nunes’ blog, which includes a very interesting graph of the M2 money multiplier (blue line below) from 1925 to 1970 (I have no idea how he obtained this dataset as I can’t seem to be able to go further back than 1959 on the FRED website).

The multiplier collapsed from 7 in 1930 to a low 2.5 in 1940 and banks that had not disappeared had plenty of excess reserves, which they maintained for a number of reasons (precautionary, lack of demand for lending, low interest rates, Hoover/FDR policies…). This situation looks very similar to what happened during our recent crisis. However, what’s interesting is that the multiplier did eventually increase. In 1970, 30 years after reaching the bottom, the multiplier was back at around 6, meaning a large increase in the money stock. This is what most people miss: it doesn’t just take a few years for new reserves to affect lending; it can take decades.
Unless the Fed takes specific actions to remove (or prevent the use of) current excess reserves, the money multiplier could well get back to its historical level within the next few decades.
NESTA’s alternative finance data goldmine
NESTA, a UK-based charity promoting innovation (and which also organised the annual UK Barcamp Bank), just released its new report on alternative finance trends in the UK. It is a goldmine. The report if full of interesting charts and figures and in many ways tells us a lot about the current state of our traditional financial sector (and possibly of the stance of monetary policy).
Some charts and comments are of particular interest. To my surprise, business lending through P2P platforms was the biggest provider of funds in terms of total amount:

According to the report:
79 per cent of borrowers had attempted to get a bank loan before turning to P2P business lending, with only 22 per cent of borrowers being offered a bank loan. 33 per cent thought it was unlikely or very unlikely that they would have been able to secure funding elsewhere had they not been successful in getting a loan through the P2P business lending platform, whereas 44 per cent of respondents thought they would have been likely or very likely to secure funding from other sources had they not used P2P business lending.
Given bank regulation that penalises banks for lending to small firms, none of this is surprising. As I keep saying, regulation is the primary driver of financial innovation. P2P business lending owes a lot to regulators… until it gets regulated itself?
Another very interesting chart was the following one:

This is crazy. Wealthy people pretty much shun P2P and other alternative finance forms. Why is that? Here’s my theory: wealthy people are usually well advised financially and have access to more investment opportunities than less-wealthy household. Consequently, a low interest environment isn’t that much of a problem (in the short-term): they have the ability to move down the risk scale to look for extra yield. On the other hand, household with more ‘moderate’ incomes do not have access to such investment opportunities: they are the ones hit by low returns on investments. P2P provides them with a unique opportunity to boost the meagre returns on their savings as long as real interest rates remain that low (i.e. lower than inflation):
[The funders] in P2P lending and equity-based crowdfunding were primarily driven by the prospect of financial returns with less concern for backing local businesses or supporting social causes.


Figures concerning P2P consumer lending are similar.
Those figures are both worrying and encouraging. Worrying because the harm that low interest rates and regulation seem to have on the economy and the traditional banking sector. Encouraging because finance is reorganising itself to respond to both borrowers’ and lenders’ demands. This is spontaneous order at work. Let just hope this does not add another layer of complexity and opacity to our already overly-complex financial system.
Financial instability: Beckworth and output gap
I recently mentioned David Beckworth’s excellent new paper on inflation targeting, which, according to him, promotes financial instability by inadequately responding to supply shocks. Like free bankers and some other economists, Beckworth understands the effects of productivity growth on prices and the distorting economic effects of inflation targeting in a period of productivity improvements.
Nevertheless, I am a left a little surprised by a few of his claims (on his blog), some of which seem to be in contradiction with his paper: according to him, current US output gap demonstrates that the nominal natural rate of interest has been negative for a while. Consequently, the current Fed rate isn’t too low and raising it would be premature.
While I believe that the real natural interest rate (in terms of money) is very unlikely to ever be negative (though some dispute this), it is theoretically and empirically unclear whether or not the nominal natural rate could fall in negative territory, especially for such a long time.
Beckworth uses a measure of US output gap calculated by the CBO and derived from their potential GDP estimate. This is where I become very sceptical. GDP itself is already subject to calculation errors and multiple revisions. Furthermore, there are so many variables and methodologies involved in calculating ‘potential’ GDP, that any output gap estimate takes the risk of being meaningless due to extreme inaccuracy, if not completely flawed or misleading.
This is the US potential GDP, as estimated by the CBO:
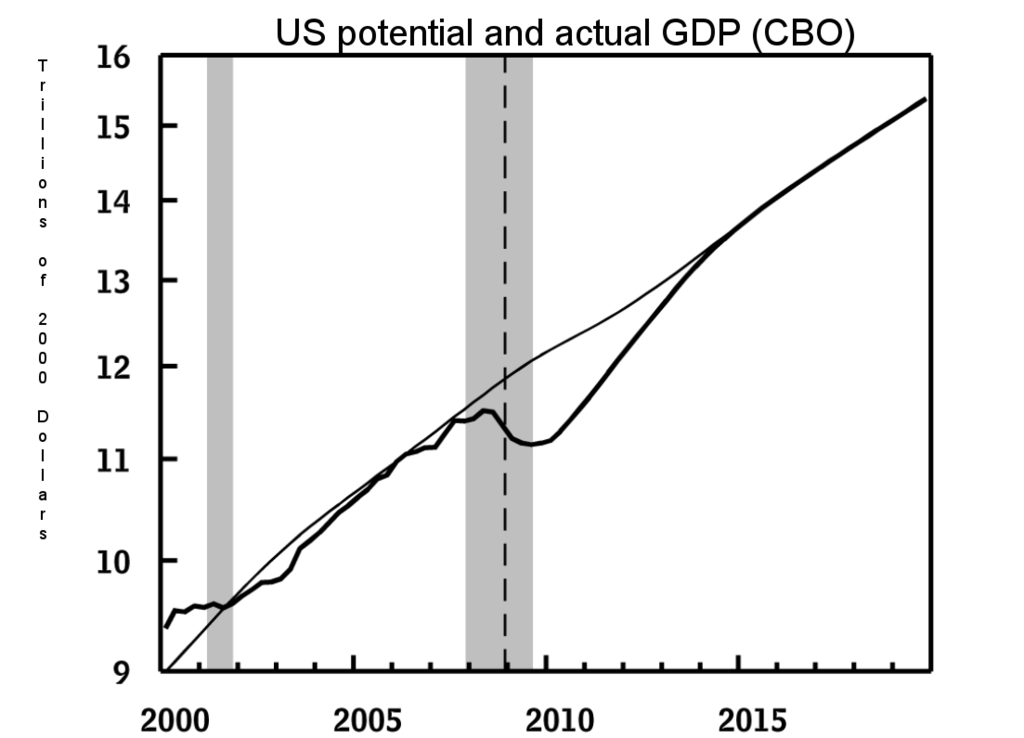
Wait a minute. For most of the economic bubble of the 2000s, the US was below potential? This estimate seems to believe that credit-fuelled pre-crisis years were merely in line with ‘potential’. This is hardly believable, and this reminds me of the justification used by many Keynesian economists: we should have used more fiscal stimulus as we are below ‘trend’ (‘trend’ being calculated from 2007 of course, as if the bubble years had never happened). Does this also mean that the natural rate of interest has been negative or close to zero since 2001? This seems to contradict Beckworth’s own inflation targeting article, in which he says that the Fed rate was likely too low during the period.
Let’s have a look at a few examples of the wide range of potential GDP estimates (and hence output gap) that are available out there*. The Economic Report of the President estimates potential GDP as even higher than the CBO’s (source: Morgan Stanley):

The Fed of San Francisco, on the other hand, estimated very different output gap variations. According to some measures, the US is currently… above potential:

Some of the methodologies used to calculate some of those estimates might well be inaccurate, or simply wrong. Still, this clearly shows how hard it is to determine potential GDP and thus the output gap. Any conclusion or recommendation based on such dataset seems to me to reflect conjectures more than evidences.
This is where we get to my point.
In his very good article, Beckworth brilliantly declares that:
the productivity gains will also create deflationary pressures that an inflation-targeting central bank will try to offset. To do that, the central bank will have to lower its target interest rate even though the natural interest rate is going up. Monetary authorities, therefore, will be pushing short-term interest rates below the stable, market-clearing level. To the extent this interest rate gap is expected to persist, long-term interest rates will also be pushed below their natural rate level. These developments mean firms will see an inordinately low cost of capital, investors will see great arbitrage opportunities, and households will be incentivized to take on more debt. This opens the door for unwarranted capital accumulation, excessive reaching for yield, too much leverage, soaring asset prices, and ultimately a buildup of financial imbalances. By trying to promote price stability, then, the central bank will be fostering financial instability.
Please see the bold part (my emphasis): isn’t it what we are currently experiencing? It looks to me that the current state of financial markets exactly reflects Beckworth’s description of a situation in which the central bank rate is below the natural rate. This is also what the BIS warned against, explicitely rejected by Beckworth on the basis of this CBO output gap estimate. (see also this recent FT report on bubbles forming in credit markets)
I am asking here how much trust we should place in some potentially very inaccurate estimates.
Perhaps the risk-aversion suppression and search for yield of the system is not apparent to everyone, including Beckworth, not helping him diagnose our current excesses. But, his ‘indicators that don’t show asset price froth’ are arguable: the risk premium between Baa-rated yields and Treasuries are ‘elevated’ due to QE pushing yields on Treasuries lower, and it doesn’t mean much that households still hold more liquid assets than in the financial boom years of 1990-2007.
At the end of the day, we should perhaps start relying on actual** – rather than estimated and potentially flawed – indicators for policy-making purposes (that is, as long as discretion is in place). Had US GDP been considered as above potential in the pre-crisis years and the Fed stance adapted as a result, the impact of the financial crisis might have been far less devastating. I agree with Beckworth: time to end inflation targeting.
* The IMF estimate also shows that the US was merely in line with potential as of 2007. Others are more ‘realistic’ but as the charts below demonstrate, estimates vary widely, along with confidence intervals (link, as well as this full report for tons of other output gap charts from the same authors):

** I understand and agree that ‘actual’ market and economic data can also be subject to interpretation. I believe, however, that the range of interpretations is narrower: these datasets represents more ‘crude’ or ‘hard’ data that haven’t been digested through multiple, potentially biased, statistical computations.

Recent Comments