Risk-weighted assets and capital manipulations
As some of you might have noticed, the Bank of International Settlements published yesterday the final version of the Basel III leverage ratio (official report can be found here). This ratio is a measure of the capitalisation of a bank for regulatory purposes. I have already mentioned a few times those capital ratios. Since the first Basel regulations were introduced, capital ratios were based on risk-weighted assets (RWAs). Some of you might already be aware of my ‘love’ of RWAs… The leverage ratio, on the other hand, gets rid of RWAs.
I am not going to speak about the leverage ratio here. But about other two other related BIS studies that, in a way, legitimate the use of unweighted capital ratios. In January 2013, the BIS published a first analysis of market RWAs. They tried to estimate the variability of risk-weights associated to equivalent securities across banks. The BIS provided 26 portfolios of financial securities to 16 different banks and asked them to risk-weigh them according to their internal models. The results were shocking (but not surprising).
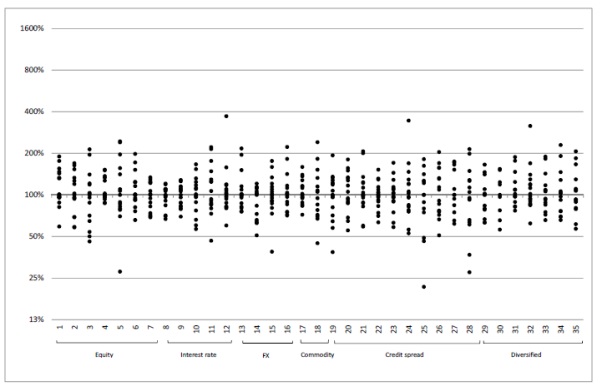
Banks mostly assess market risks using statistical Value-at-Risk models. The graph below shows the dispersion of the results provided by the banks’ VaR models. The results are normalised so that the median result is centred on 100%.

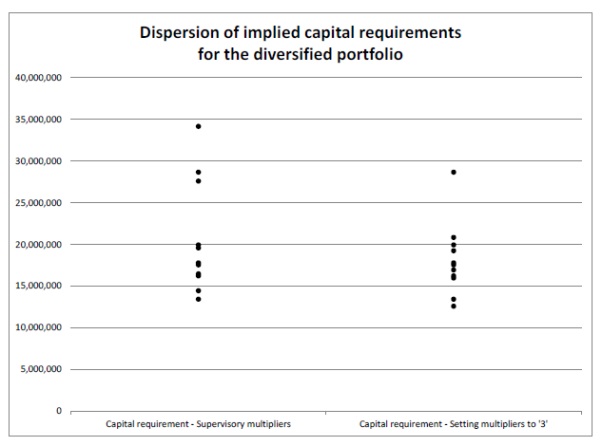
The dispersion is huge. Some banks judged portfolio 14 as being around 1000% riskier than the median bank’s perception of it (and I am not even talking about the most conservative one). Some comfort could be taken from the diversified portfolios (25 and 26), which are closer to real life portfolios. Nonetheless, even in those, variations are large enough to undermine the credibility of the risk-weights applied to them. The chart below demonstrates the capital requirements (in Euros) implied from the VaR results above for portfolio 25. Some banks would put aside more than twice the amount of capital than others would, for the same portfolio of securities.
The BIS believed at that time that different local regulatory requirements were partially responsible for the results (such as some banks following Basel 2.5 and others Basel 2. I’m going to skip the details but Basel 2.5 pushes market RWAs up).
The BIS eventually published its final study on market RWA at the end of December. This time, all banks had implemented Basel 2.5. So most of the observed variation could only come from the banks’ internal model differences. What did they find?
Not much difference. Variations were still huge. The resulting implied capital requirements (in thousands of Euros) for portfolios 29 and 30 were as follows:

Clearly, RWAs are unreliable. This questions the very utility of RWA-based regulatory capital ratios. How can one actually trust two different banks both reporting 10% Tier 1 ratios? One of them might in reality hold twice as little capital as the other one for what is actually the same risk level. Banks can easily game the system. Moreover, the FT was reporting yesterday that some banks were starting to report RoRWA (return on RWAs) instead of more traditional return on equity or return on assets. But those measures suffer from the exact same defects. While an unweighted leverage ratio is clearly not perfect, RWAs introduce far too much information distortion and even potentially exacerbate the business cycle. Time to get rid of them.
Recent Comments
| pslebow on ‘Sovereign money’:… | |
| pslebow on A critique of Werner’s view on… | |
| Hugo Kramer on Welcome to Spontaneous Fi… | |
| Nathan on A critique of Werner’s view on… | |
| Nathan on More, more, more money endogen… |

Trackbacks / Pingbacks