Secular stagnation: factoring in banking regulation
David Beckworth wrote a good post on the secular stagnation hypothesis, highlighting the problem with the interpretation of the natural rate by secular stagnation theorists. This is Beckworth:
First, real interest rates adjusted for the risk premium have not been in a secular decline. Everyone from Larry Summers to Paul Krugman to Olivier Blanchard ignore this point in the book. They all claim that real interest rates have been trending down for decades. The editors of the book, Coen Teulings and Richard Baldwin, even claim that this development is the ‘prima facie’ evidence for secular stagnation. What they are doing wrong is only subtracting expected inflation from the observed nominal interest rate. They also need to subtract the risk premium to get the natural interest rate, the interest rate at the heart of the story. For it is the natural interest rate that is affected by expected growth of technology and the labor force.
He is right. But I believe there is more to the story.
This is Beckworth’s chart highlighting the apparent secular decline in interest rates as believed by secular stagnation adherents. I added to it Basel 1, Basel 2 and Basel 3 introductions (red lines) and discussions (orange area) (unlike in Europe, only a few US banks had implemented Basel 2 when the crisis started):
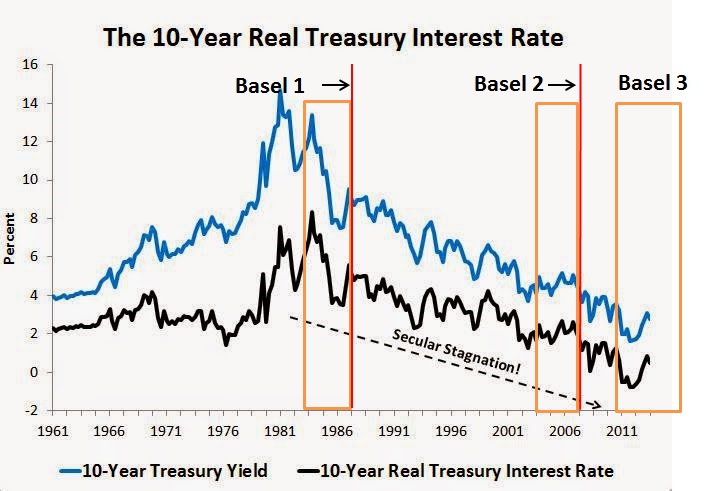
What is striking is the fact that Treasury yields started declining exactly when Basel 1 was being discussed and implemented. There is a clear reason for this: Basel introduced risk-weighted assets, and government securities were awarded a 0% risk-weight, meaning banks could purchase them and hold no capital against them. As I have described before, banks were then incentivised to pile in such assets to maximise RoE, as a quick risk-adjusted return on capital calculation demonstrates. Basel 1 also introduced risk-weights for other asset classes such as business and mortgage lending. Structural changes in lending* and government securities markets occurred directly post-Basel. I believe this is no coincidence.
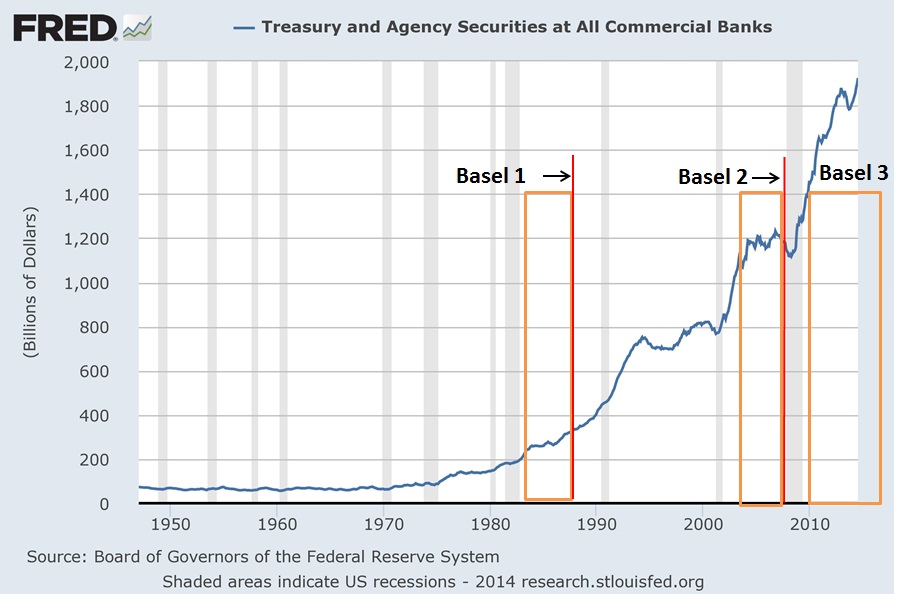
Take a look at the following chart. Until the 1980s, the volume of US government securities on US banks’ balance sheet was pretty much constant. Everything changed from the 1980s onward:
As a share of banks’ total assets (see chart below), US government securities literally spiked after Basel 1 was introduced, only to decline (as a share of total assets) as banks started piling in other assets that benefited from generous capital treatments such as securitisations and insured mortgages (though this doesn’t mean demand faded as banks balance sheets grew quickly over the period, just that demand for other assets was even stronger). Post-crisis, Basel 3 renewed the demand for US sovereign debt as it 1. modified the capital treatment of some previously lowly-weighted assets and 2. introduced minimum liquidity requirements (LCR) as well as margins and collateral requirements that require the use of high-quality liquid assets such as Treasuries.

We identify the same pattern as a share of total securities on US banks’ balance sheet**:

The demand for Treasuries also boomed throughout the financial sector due to those margin/collateral/liquidity requirements that apply (mostly post-Basel 3), not only to commercial banks, but also to broker dealers and investment managers:

All those regulations evidently artificially increase demand for US government-linked securities, pushing their yields down.
But I guess you’re going to tell me that Beckworth’s adjusted risk-free Treasury yield was actually stable over the whole period (chart below). Actually, unlike what Beckworth claims, it does look like there is a slight decline since the end of the 1980s. Moreover, ups and downs almost exactly coincide with banks decreasing/increasing their relative holdings of Treasuries (see above, third chart). Finally, there is also another option: that the natural (risk-free) rate of interest’s trajectory was in fact upward, which would be hidden by financial regulations’ artificially-created demand…

However, this analysis is incomplete: it does not account for foreign banks’ demand for Treasuries, which is also a widely-held asset as part of banks’ liquidity buffers (and in particular when their own sovereign fails…). I unfortunately don’t have access to such data.
In the end, the use of Treasury yield (even adjusted) as an estimate of the natural rate of interest is unreliable given the numerous microeconomic variables that distort its level.
* See this chart from one of my previous posts:

** Post-WW2’s very high figures (close to 100%) reflect the low level of corporate securities issued following the Great Depression and WW2, the high issuance volume of US sovereign debt to fund the war, as well as restrictions on banks’ securities holding to facilitate such wartime issuances.
3 responses to “Secular stagnation: factoring in banking regulation”
Leave a comment
Recent Comments
| pslebow on ‘Sovereign money’:… | |
| pslebow on A critique of Werner’s view on… | |
| Hugo Kramer on Welcome to Spontaneous Fi… | |
| Nathan on A critique of Werner’s view on… | |
| Nathan on More, more, more money endogen… |

When I read Beckworth’s blog earlier I thought he made some good arguments, but at the same time something didn’t seem right. It took me until now to figure out what that was. Part of the story is the impact of Basel on Treasury yields that you point out, but part of it is more theoretical.
David does a good job of stripping the components of interest into three parts: inflation expectations, risk, and time preference (aka “natural rate”). But something intuitively seemed wrong about using Treasuries as an indicator of the natural rate, even though in standard financial theory, it should be best because of their “risk-free” status.
Then it just occurred to me while reading your post, in addition to the regulatory causes of artificial demand, Treasuries will only be an accurate indicator if the Fed’s policy is neutral to the natural rate. To support my claim, look at David’s own chart. In the years where the risk-free real rate is zero or even negative are periods where there was price or asset inflation. And theoretically, why would time-preference ever be negative?
Yes this is something I pointed out in other posts as well. I am yet to read a convincing argument that the natural rate can turn negative.
Even if the supply of loanable funds (savings) vastly exceed the demand for them in the short run for some reason, the rate should approach zero, not turn negative. In mathematical terms, we could say that the limit of the natural rate when supply approaches infinity, with demand constant, is zero.
Why lend money at a negative rate and effectively waste capital (especially in an inflationary environment) when this capital could simply be conserved by hoarding the money in a box for close to no cost.
I agree 100%. Under the classical gold standard, particularly in countries that had better (free) banking institutions, I believe inverted yield curves were unheard of. The short term rate was volatile but remained below the long term rates. And since the rate of inflation was near zero, and nominal rates were sufficiently positive, negative real yields were also unheard of.
I need to do more research to support this thesis, but the Fed has added a lot of good data from that time period which I can play with eventually.